Business Survival Rates by State: How Many New Businesses Make It to Year Five?
About half of all new U.S. businesses are gone within five years, but survival is not the same everywhere. We compiled the U.S. Bureau of Labor Statistics' establishment-survival data into a single ranking of 1- and 5-year survival for all 50 states plus DC, and dug into what the numbers do, and do not, mean for anyone deciding whether to form an LLC.
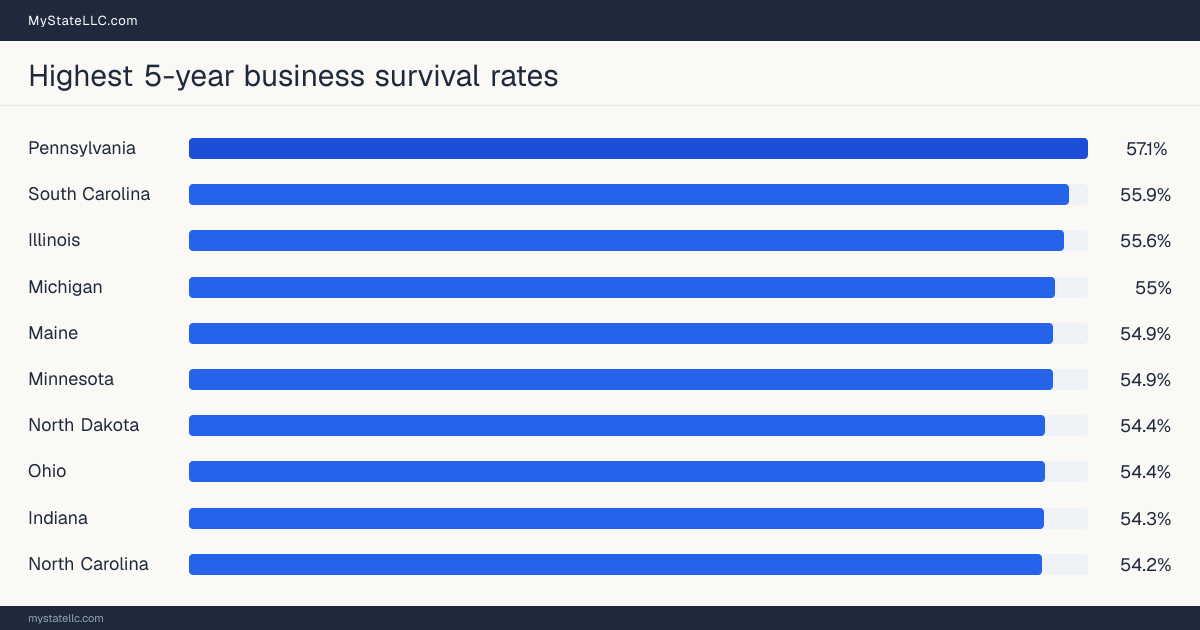
The states where businesses last longest
Ranked by five-year survival, the share of private-sector establishments still operating five years after opening (the 2020 opening cohort). Pennsylvania leads the nation; the top of the table is dominated by the industrial Midwest and mid-Atlantic rather than the fast-growing Sun Belt.
The headline findings
Highest 5-year survival
- Pennsylvania57.1%
- South Carolina55.9%
- Illinois55.6%
- Michigan55%
- Maine54.9%
Share of 2020-cohort establishments still open after five years.
Lowest 5-year survival
- Washington42.2%
- District of Columbia42.4%
- Missouri42.9%
- Idaho45.6%
- Oregon45.8%
The bottom five jurisdictions, lowest first.
The national picture
- Survive 1 year77.9%
- Survive 5 years51.4%
- Survive 10 years34.7%
- Survive 15 years25.5%
U.S. private-sector establishments by opening-year cohort.
Business survival rates for all 50 states plus DC
Ranked by five-year survival (rank 1 = highest). The one-year column is shown alongside because the two do not always move together, a few states with strong first-year retention slip sharply by year five.
| Rank | State | 5-year survival | 1-year survival |
|---|---|---|---|
| 1 | Pennsylvania | 57.1% | 78.8% |
| 2 | South Carolina | 55.9% | 82.3% |
| 3 | Illinois | 55.6% | 79.7% |
| 4 | Michigan | 55% | 77.6% |
| 5 | Maine | 54.9% | 76.9% |
| 6 | Minnesota | 54.9% | 79.4% |
| 7 | North Dakota | 54.4% | 79.1% |
| 8 | Ohio | 54.4% | 78.7% |
| 9 | Indiana | 54.3% | 79.5% |
| 10 | North Carolina | 54.2% | 76.1% |
| 11 | Kentucky | 54.1% | 78.7% |
| 12 | California | 53.7% | 80.3% |
| 13 | Iowa | 53.7% | 80.2% |
| 14 | West Virginia | 53.6% | 76.3% |
| 15 | Mississippi | 53.5% | 77.9% |
| 16 | Montana | 53% | 78.3% |
| 17 | Louisiana | 52.9% | 80.4% |
| 18 | Massachusetts | 52.7% | 76.4% |
| 19 | South Dakota | 52.7% | 78.5% |
| 20 | Texas | 52.5% | 78.4% |
| 21 | Wisconsin | 52.4% | 79.5% |
| 22 | Arizona | 52.1% | 79% |
| 23 | New York | 51.9% | 79.6% |
| 24 | Alabama | 51.4% | 77.1% |
| 25 | Connecticut | 51.1% | 78.2% |
| 26 | Hawaii | 51% | 77.1% |
| 27 | Nebraska | 50.9% | 78.8% |
| 28 | Alaska | 50.8% | 74.4% |
| 29 | New Jersey | 50.5% | 79.3% |
| 30 | Oklahoma | 50.2% | 73.5% |
| 31 | Maryland | 50.1% | 75.5% |
| 32 | Georgia | 49.9% | 75.1% |
| 33 | Utah | 49.7% | 76.3% |
| 34 | Florida | 49.5% | 76% |
| 35 | Virginia | 48.8% | 76% |
| 36 | Colorado | 48.5% | 75.9% |
| 37 | Delaware | 48.1% | 72.8% |
| 38 | Rhode Island | 48.1% | 77.9% |
| 39 | Arkansas | 48% | 76.6% |
| 40 | New Hampshire | 47.7% | 75.1% |
| 41 | Nevada | 47.6% | 75.9% |
| 42 | Wyoming | 47.5% | 75.2% |
| 43 | Kansas | 47.4% | 76.4% |
| 44 | Vermont | 46.6% | 75.9% |
| 45 | Tennessee | 46.4% | 70.7% |
| 46 | New Mexico | 46.3% | 77% |
| 47 | Oregon | 45.8% | 73.3% |
| 48 | Idaho | 45.6% | 76.6% |
| 49 | Missouri | 42.9% | 74.1% |
| 50 | District of Columbia | 42.4% | 67.1% |
| 51 | Washington | 42.2% | 82.5% |
What the survival numbers actually tell us
The single most useful number on this page is the national five-year rate: 51.4% of new private-sector establishments are still operating five years after they open. That is a far cry from the folklore that “most businesses fail in the first year.” In reality, first-year survival is 77.9% , only about 22.1% of new establishments close within twelve months. The real attrition is gradual: survival falls to 51.4% at five years, 34.7% at ten, and 25.5% at fifteen. Roughly half of new businesses reach year five, and about a quarter are still going at year fifteen.
The best and worst states are 14.9 points apart
14.9 ptsgap in five-year survival between Pennsylvania and WashingtonWhere a business operates is correlated with how long it lasts, though the spread is narrower than most “best state for business” marketing implies. Pennsylvania leads five-year survival at 57.1%, followed by South Carolina (55.9%), Illinois (55.6%), Michigan (55%), and Maine (54.9%). At the bottom, Washington trails the field at 42.2%, just below District of Columbia (42.4%) and Missouri (42.9%). The full 14.9-point range means a business in the strongest state is meaningfully more likely to reach year five than one in the weakest, but every state clusters around the national 51.4% average far more tightly than around the extremes.
The one-year and five-year columns are worth reading together, because they do not always agree. Washington is a striking example: it posts a strong one-year survival rate of 82.5% yet the lowest five-year rate in the country (42.2%). A high early-survival state can still shed a disproportionate share of its businesses between years two and five, so a single-year snapshot is a poor guide to the durability that actually matters when you are planning a business.
Survival rates are for private-sector establishments by opening year; used as the closest federal proxy for new-business survival. These are establishment survival rates. They measure whether a specific business location kept operating, not whether its owner succeeded or failed. A business that closes because it was sold, merged, relocated, or wound down by a founder who moved on counts the same as one that went under. Read the state gaps as a signal about the local operating environment, not as a verdict on any individual entrepreneur, and treat the numbers as a federal proxy for new-business durability, since the underlying data tracks establishments rather than firms or LLCs specifically.
Why the survival map looks nothing like the growth map
The states with the highest survival are, for the most part, not the states adding businesses fastest. The upper reaches of this table lean toward established Midwestern and mid-Atlantic economies, Pennsylvania, Illinois, and Michigan among them, rather than the high-growth Sun Belt markets that top formation rankings. That divergence is the whole reason survival is worth studying separately from formation: a state can mint enormous numbers of new businesses while a below-average share of them endure, and another can grow slowly but keep a larger fraction of its businesses alive to year five. If your question is not “where are people starting businesses?” but “where do businesses last?”, this ranking, not a formation leaderboard, is the one to read.
What this means for your LLC budget
If only about half of new businesses reach year five, the practical lesson is to plan your finances around a multi-year runway rather than a single launch year. An LLC is not a one-time cost: after the initial filing fee you owe recurring charges, annual report fees, registered agent fees, and in some states franchise taxes. Every year the business stays open. Because survival to year five is roughly a coin-flip nationally (51.4%), it is worth knowing the full multi-year cost of your LLC before you commit, so the structure never costs more than it is worth to keep alive.
Two of our tools model exactly this. The 5-year LLC true-cost calculator projects what an LLC actually costs over the same five-year window most of this data is measured against, formation plus every year of recurring fees, so you can size a realistic budget. And the compare-states tool puts filing fees, annual report costs, and 5-year totals for any two states side by side, which matters more than the survival gap for most owners, since the right state is almost always the one you actually operate in.
Methodology & data notes
Figures come from the U.S. Bureau of Labor Statistics, Business Employment Dynamics (BED), which tracks how many private-sector establishments that opened in a given year are still operating in each subsequent year. National 1-, 5-, 10-, and 15-year rates are measured by opening-year cohort: the 1-year rate reflects establishments that opened in 2024, the 5-year rate the 2020 cohort, the 10-year rate the 2015 cohort, and the 15-year rate the 2010 cohort. State figures cover one- and five-year survival for all 50 states plus the District of Columbia.
An important caveat on what is being counted. Survival rates are for private-sector establishments by opening year; used as the closest federal proxy for new-business survival. BED measures establishments , physical business locations, by their opening year, not firms or LLCs specifically, and an establishment “closing” is not the same as a business failing. Closures include sales, mergers, relocations, and voluntary wind-downs. We use these rates as the closest consistent federal proxy for new-business survival, but they should be read as a durability signal rather than a precise LLC failure rate.
Data retrieved 2026-07-16 via archived snapshots of the BLS source pages. The underlying BLS data is public domain; our compiled ranking is released under a CC BY 4.0 license.
Last updated July 2026.
Cite this study
This dataset is free to republish under a Creative Commons Attribution (CC BY 4.0) license. Journalists and researchers are welcome to cite the figures with a link back.
MyStateLLC Business Survival Rates by State (2026). One-, five-, ten-, and fifteen-year business survival rates by state and opening-year cohort. Source: U.S. Bureau of Labor Statistics, Business Employment Dynamics. Available at: https://www.mystatellc.com/research/business-survival-rates
<p>Source: <a href="https://www.mystatellc.com/research/business-survival-rates">MyStateLLC Business Survival Rates by State</a>, based on U.S. Bureau of Labor Statistics, Business Employment Dynamics.</p>
Frequently Asked Questions

Edmond Hui · Founder, MyStateLLC
Edmond Hui is a software engineer and serial entrepreneur based in New York who has founded multiple online businesses across e-commerce, media, and information publishing. Before transitioning into tech, he spent years as a commercial real estate professional closing deals totaling over 100,000 square feet, giving him firsthand experience with business formation and entity structuring. He built MyStateLLC to provide the free, state-specific LLC guidance he wished existed when forming his own companies.